
You have been running UGC video ads for months. When your manager asks 'Is it actually working?' you do not have a clear answer. This guide fixes that.
You have been running UGC video ads for a few months. The content looks good, creators always delivered on time, and your team is happy with the videos. But then your manager asks the question you have been dreading: 'So, is it actually working?' And you realise you do not have a clear answer. This is one of the most common situations brand managers and performance marketers face when they start investing in UGC content.
The videos feel right. You believe it is working. But what your manager needs is not just a feeling, you need to prove it with specific numbers. Without a proper measurement framework, that belief cannot be proved and is even harder to scale.
Measuring the ROI of UGC video content does not need to be complicated. It just needs to be intentional. Here is a step-by-step framework that performance marketers use to track UGC performance properly, justify spend, and make smarter creative decisions.
Why measuring UGC ROI is harder than it looks
The challenge with UGC is that its impact does not always show up in the most obvious places. A UGC video that drives significant brand awareness might not directly close a sale. A creator testimonial might be the third touchpoint a customer encounters before buying, not the first. If you only measure direct revenue attribution, you will consistently undervalue what UGC is doing for your business.
On top of that, most brands make the mistake of running one or two UGC videos, checking the results after a week, and drawing conclusions too early. UGC creative testing requires volume and patience. You need enough data to make decisions, not just impressions from the first 48 hours. The good news is that once you have the right metrics in place, UGC becomes one of the most measurable content formats available to you.
Step 1: Define what success looks like before you launch
Before you run a single UGC ad, you need to decide what you are actually trying to achieve. This sounds obvious, but it is the step most brands have already skipped, and it is the reason they end up with results they cannot interpret.
Are you trying to increase direct sales? Lower your cost per acquisition? Build brand awareness in a new market? Drive traffic to a product page? Each of these goals requires tracking completely different metrics. A campaign designed to build awareness should not be judged on direct revenue, and a conversion campaign should not celebrate high view counts if purchases are not following. Write your primary goal down before the campaign goes live.
Step 2: Track the four numbers that actually matter
Once your goal is clear, these are the four core metrics that tell you whether your UGC content is performing:
- Hook rate is the percentage of viewers who watch past the first three seconds. A good hook rate sits above 30%. If you are below that, your opening is not grabbing attention quickly enough and your video is being skipped before your message has a chance to land.
- Watch time tells you how long people are actually staying with your content. Longer watch time signals the content is relevant and engaging. On platforms like TikTok, high watch time also tells the algorithm to distribute your video more widely. A sudden drop in watch time at a specific moment also tells you exactly where you are losing people.
- Click-through rate shows whether viewers are taking action after watching. Even a small improvement in CTR, say from 1% to 2%, can effectively cut your cost per result in half while maintaining the same ad spend. High watch time with low CTR usually means your content is engaging but your call to action is not landing.
- Cost per result is your bottom-line metric. Whether your result is a purchase, a lead, a sign-up, or an add-to-cart, this number tells you what you are paying for each one. If cost per result goes down while volume goes up, your UGC is working.
Step 3: Compare UGC against what you are already running
The most important question is not 'did UGC work?' It is 'did UGC work better than what we were already running?' The only way to answer that properly is to run a split test. Set up your UGC videos alongside your existing best-performing ads. Same audience, same budget, same campaign objective. Let both run simultaneously so the comparison is fair.
After data has accumulated, usually at least 1,000 impressions per creative, you will have a clear picture of which format is actually driving better results. In most cases, UGC-style content outperforms polished studio ads on TikTok and Meta because it blends into the feed instead of triggering the built-in 'this is an ad, skip it' response.
Step 4: Test multiple versions before scaling anything
This is where most brands leave significant money on the table. They find a UGC creator they like, run one or two videos, see reasonable results, and scale those specific videos without ever testing whether a different hook, angle, or format might perform dramatically better.
The difference between a 1% CTR and a 3% CTR is often just the first five words of the video. A different opening line, a different creator energy, a different problem addressed in the hook, these small variables can completely change how the same product is received by the same audience. Brief multiple creators for the same product. Try different opening hooks such as a question, a bold statement, a surprising fact, or a relatable problem. If briefing multiple creators every time feels slow or expensive, tools like Anivision AI can generate additional UGC-style variations of your winning script quickly.
Step 5: Calculate your actual ROI
When your campaign has gathered enough data, use this formula:
ROI = (Revenue generated minus Cost of UGC production) divided by Cost of UGC production, multiplied by 100
If you spent £500 on UGC content, already including creator fees, platform costs, and editing, and it generated £2,500 in tracked revenue, your ROI is 400%. Include every cost. Be honest with the numbers. A 100% ROI on a first test is already a strong result and a clear signal to invest more.
For campaigns where direct revenue attribution is difficult, use proxy metrics: engagement rate, follower growth during the campaign, brand search volume, and sentiment in the comments.
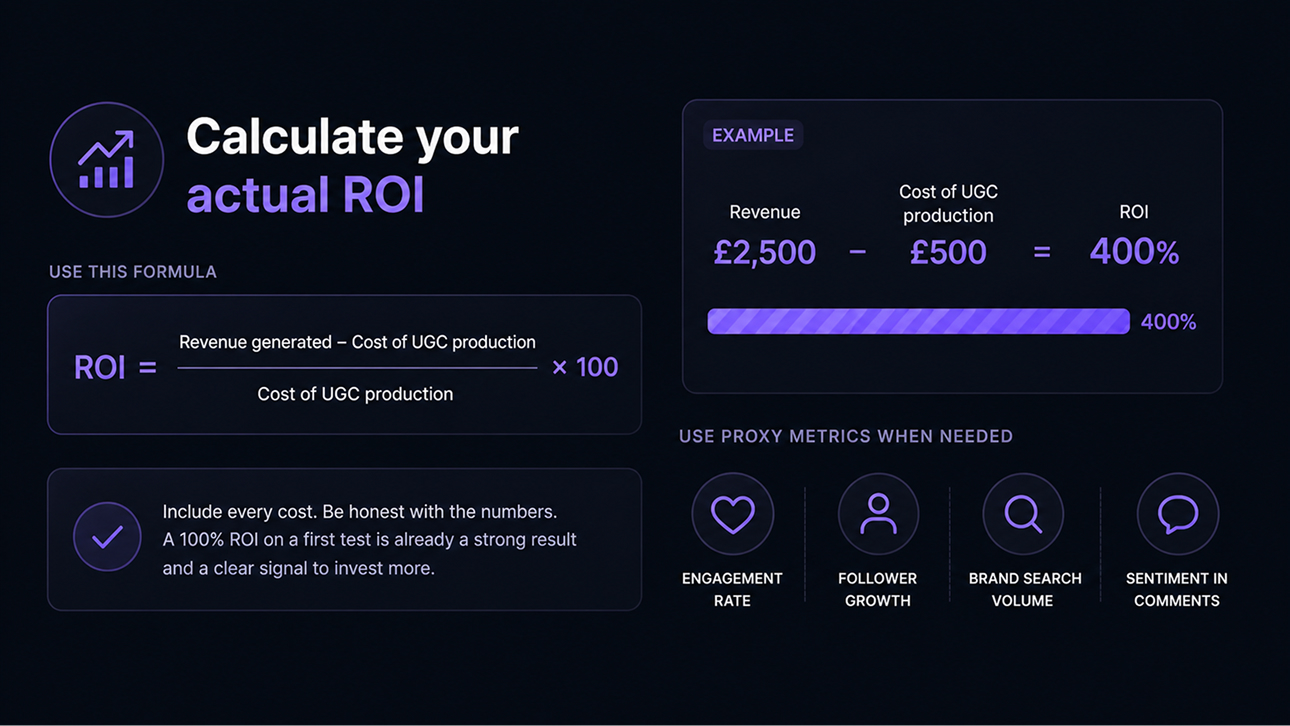
Calculate your actual ROI. (AI-generated diagram)
Case Study: MVMT Watches
MVMT launched in 2013 with almost no marketing budget. In the early days, the team ran UGC-style ads on Facebook and Instagram but had no real measurement system, mostly looking at likes and shares and making gut-call decisions about what to scale.
When they introduced proper tracking across hook rate, watch time, CTR, and cost per acquisition, they discovered something unexpected: casual, phone-filmed UGC videos were generating a CTR three times higher than their polished studio creative. Cost per acquisition dropped from $38 to $9 when they shifted budget toward the UGC formats the data had identified as winners. They scaled aggressively and grew to $90M in revenue before being acquired by Movado Group for $100M in 2018.
The measurement framework did not just help them prove ROI, it gave them the confidence to invest more at exactly the right moment.
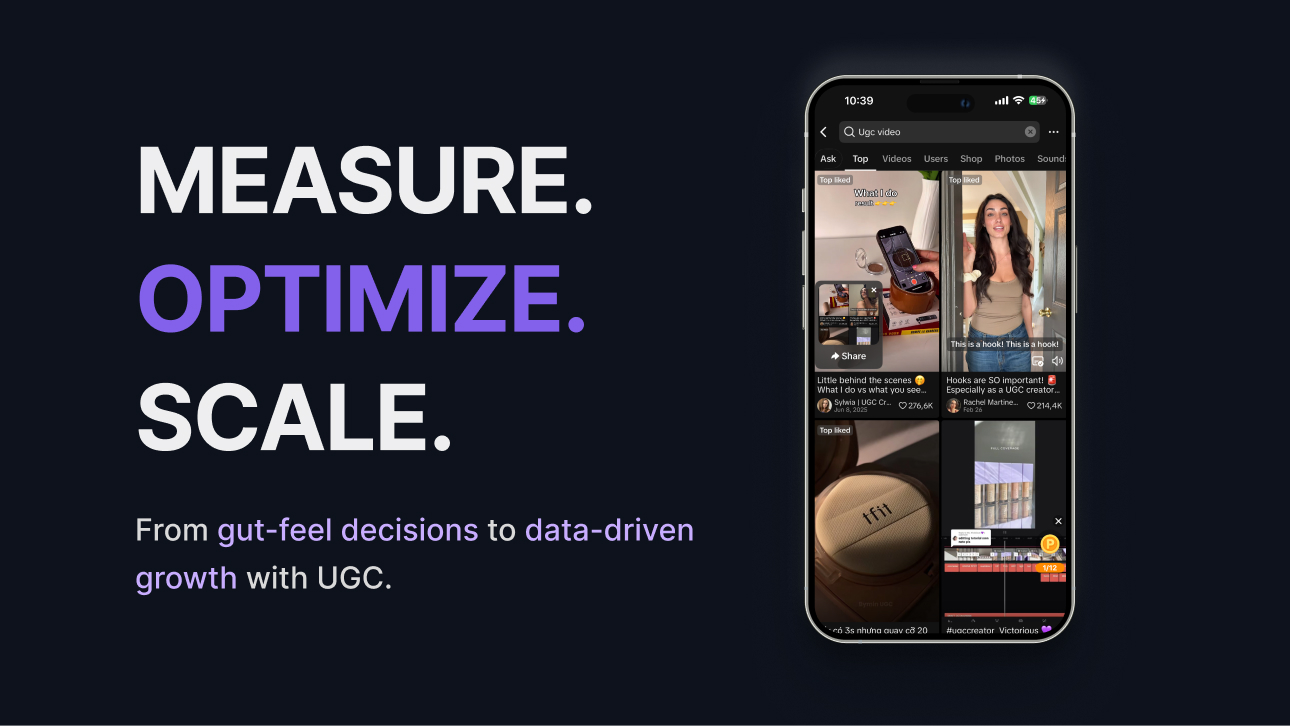
TikTok search results for "ugc video": real UGC content from creators filming products in everyday settings. Source: TikTok (search: ugc video)